“A foundational issue in addressing housing affordability is increasing the supply of housing, which will put downward pressure on prices over time. This increase in supply can take many forms, from traditional suburban-style single-family homes as part of a large development to the construction of multi-family apartment buildings. As the population of Las Vegas continues to grow and approaches three million people in the coming decades, ensuring a sufficient amount of housing to maintain steady economic growth is of paramount importance.
In this brief, we examine recent housing development across the Las Vegas MSA and contrast it with other metropolitan areas. Utilizing data on building permits tracked by the U.S. Census Bureau, we leverage the number of permits issued through June 2026 to serve as an initial comparison point before looking at the one-year and five-year change in permit activity. This brief is a companion piece to previous Lied Center work, which examined longer term trends in building permits in the Las Vegas Metropolitan Statistical Area (MSA) relative to a select group of metropolitan areas. In this brief, we focus on the building environment post-COVID and compare the rate of permit issuance in Las Vegas to a broader set of Mountain West and West Coast MSAs, as well as to all large metropolitan areas nationwide.”
/wp-content/uploads/2026/06/CREDA-formerly-naiop-header-logo_157x80.png00CREDA Southern Nevada/wp-content/uploads/2026/06/CREDA-formerly-naiop-header-logo_157x80.pngCREDA Southern Nevada2026-09-25 18:13:582026-10-09 18:30:25The Lied Research Report | Short on the Strip: Examining the Housing Permit Deficit in Las Vegas
Last year, the Southern Nevada Strong Underutilized Lands Inventory (“the ULI study”) identified 78,285 acres of vacant or “underutilized” land within urbanized Clark County. CREDA’s development community quickly recognized that this figure did not reflect the amount of land realistically available for development and that, without important context, it could shape an inaccurate regional narrative. CREDA therefore moved to commission RCG Economics to provide an independent technical and market-based analysis of the ULI study.
RCG found that the inventory offers useful baseline data but does not consider several factors that determine whether land can realistically be developed, including ownership, title restrictions, zoning, infrastructure, site conditions, costs and market feasibility. These findings provide important context for understanding the region’s continued need for thoughtful federal lands policy.
The CREDA-commissioned analysis has also led to deeper communication with RTC and other local stakeholders, helping ensure that planning for Southern Nevada’s future reflects both public-sector objectives and real-world development considerations.
/wp-content/uploads/2026/06/CREDA-formerly-naiop-header-logo_157x80.png00CREDA Southern Nevada/wp-content/uploads/2026/06/CREDA-formerly-naiop-header-logo_157x80.pngCREDA Southern Nevada2026-07-21 17:50:362026-07-21 18:34:57Beyond the Acreage: What Southern Nevada’s Land Inventory Really Tells Us
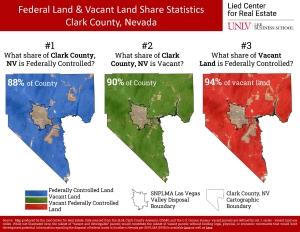
88% of Land in Clark County is Federally Controlled
Did you know these statistics about land in southern Nevada?
The vast majority of developable land that remains in Clark County is controlled by the Federal Government. 94% of vacant land in Clark County is federally controlled.
While we often hear about “urban sprawl” as a concern, in Southern Nevada we are among the most densely populated metropolitan areas in the nation.
In fact, according to the Lied Research Report released in May of 2026:
“In terms of density, the Las Vegas-Henderson Paradise, NV MSA ranks as the 16th most dense MSA out of 233, placing it in the top 7% nationally, ahead of the San Diego-Chula Vista-Carlsbad, CA MSA, the Houston-The Woodlands-Sugar Land, TX MSA, and the Phoenix-Mesa-Chandler, AZ MSA. Similarly, on street connectivity, the Las Vegas MSA ranks 13th out of 233, placing it in the top 6% of the most connected metropolitan areas in the country. On the overall compactness index, the Las Vegas MSA ranks 69th out of 233, placing it in the top 30% of least sprawling metropolitan areas in the United States.
Contributing to these findings is the fact that roughly 88% of Clark County is managed by the federal government, which constrains outward expansion and concentrates development within a
bounded footprint commonly referred to as the SNPLMA Disposal Boundary. This structural factor contributes to the metro’s comparatively high-density profile.”
Source: Map produced by the Lied Center for Real Estate. Data sourced from the BLM, Clark County Assessor, GISMO, and the U.S. Census Bureau. Vacant parcels are defined by cat. 1 series – vacant land use codes. While not illustrated here, the subset of “vacant and developable” parcels would constitute the subset of vacant parcels without binding legal, physical, or economic constraints that would limit development potential. Information regarding the disposal of federal lands in Southern Nevada per SNPLMA (1998) is available here as well as here.
/wp-content/uploads/2026/06/CREDA-formerly-naiop-header-logo_157x80.png00CREDA Southern Nevada/wp-content/uploads/2026/06/CREDA-formerly-naiop-header-logo_157x80.pngCREDA Southern Nevada2026-06-01 13:24:302026-10-13 13:25:3594% of Vacant Land in Clark County is Federally Controlled
“Urban sprawl is increasingly cited as a defining characteristic of Las Vegas, yet the empirical basis for that characterization is rarely directly examined. To provide both the public and private sectors with a data-driven perspective, this brief summarizes the findings of Hamidi et al. (2026), Who Sprawls the Most? Mapping Urban Sprawl and Assessing Its Impact on Everyday Life, a national study from Johns Hopkins University that ranks 233 U.S. metropolitan statistical areas (MSAs), representing 85% of the U.S. population, on a composite compactness-sprawl index.
In terms of density, the Las Vegas-Henderson- Paradise, NV MSA ranks as the 16th most dense MSA out of 233, placing it in the top 7% nationally, ahead of the San Diego-Chula Vista-Carlsbad, CA MSA, the Houston-The Woodlands-Sugar Land, TX MSA, and the Phoenix-Mesa-Chandler, AZ MSA. Similarly, on street connectivity, the Las Vegas MSA ranks 13th out of 233, placing it in the top 6% of the most connected metropolitan areas in the country. On the overall compactness index, the Las Vegas MSA ranks 69th out of 233, placing it in the top 30% of least sprawling metropolitan areas in the United States.
Contributing to these findings is the fact that roughly 88% of Clark County is managed by the federal government, which constrains outward expansion and concentrates development within a bounded footprint commonly referred to as the SNPLMA Disposal Boundary. This structural factor contributes to the metro’s comparatively high-density profile. The Las Vegas MSA ranks 125th out of 233 on land use mix, reflecting a degree of separation between residential areas and employment and commercial corridors that characterizes much of the valley’s development pattern. This is the one dimension on which the index places Las Vegas below the national average.
Turning to Northern Nevada, the Reno, NV MSA ranks 46th out of 233 on the overall compactness sprawl index, placing it in the top 20% of least sprawling metros and 32nd on urban centering (top 14%).
This data brief presents index scores and rankings for both Nevada MSAs, contextualizes those findings relative to peer metropolitan areas, and provides the full 233-MSA dataset in the Appendix.
About the Data
The Hamidi et al. (2026) study (hereafter “The study”) led by researchers at the Johns Hopkins Bloomberg School of Public Health covers 233 metropolitan statistical areas (MSAs) representing a comprehensive update to a previous sprawl measurement study1. The study assigns each MSA a composite compactness-sprawl index score built from four equally weighted dimensions:
• Density: Measures the intensity of residential and employment development. Indicators include population density, the share of population living at low versus high urban densities, gross employment density, and net population density2 within urban places.
• Land Use Mix: Captures the degree to which homes, jobs, and services are integrated rather than separated. Measured through job-population balance, degree of job mixing, and average Walk Score.”
/wp-content/uploads/2026/06/CREDA-formerly-naiop-header-logo_157x80.png00CREDA Southern Nevada/wp-content/uploads/2026/06/CREDA-formerly-naiop-header-logo_157x80.pngCREDA Southern Nevada2026-05-20 18:45:282026-10-09 18:51:06The Lied Research Report | 2026 Urban Sprawl Rankings: Las Vegas and Reno, Nevada Understanding sprawl and density in Nevada’s largest cities.
NAIOP Southern Nevada commissions study that evaluates how short-term and long-term developable land constraints could impact the region’s economic strength and stability.
RCG Economics prepared the 2020 Southern Nevada Industrial Land Analysis for NAIOP Southern Nevada. The study evaluates whether short-term and long-term developable land constraints could negatively impact the region’s economic strength and resilience.
“For many years, NAIOP Southern Nevada has been advocating for the importance of a balanced approach to managing federal lands in Southern Nevada,” said Julie Cleaver, Chapter President. “Expansion of the disposal boundary of the Southern Nevada Public Lands Management Act, coupled with a regional plan, will allow for efficient development and keep the region competitive.”
/wp-content/uploads/2026/06/CREDA-formerly-naiop-header-logo_157x80.png00/wp-content/uploads/2026/06/CREDA-formerly-naiop-header-logo_157x80.png2020-08-04 11:51:332021-02-15 18:33:592020 SOUTHERN NEVADA INDUSTRIAL LAND STUDY
May 2016 – NAIOP Southern Nevada, the commercial real estate development association, announced the results of a study that illustrates the impact of land constraints on economic development in Southern Nevada. The study, undertaken by Alan Schlottmann of the Theodore Roosevelt Institute, shows that under the restraints imposed by the Bureau of Land Management’s recent Draft Resource Management Plan, economic growth in the Las Vegas valley will be restricted and hinder the future growth of our economy. Read more