Developing, Owning and Operating Shallow Bay Industrial Buildings
AUGUST 2026

Shallow bay industrial buildings – long overlooked in favor of larger, single-tenant logistics facilities – are drawing renewed attention from institutional investors and lenders as constrained supply and resilient tenant demand set the stage for continued outperformance

The CREDA Research Foundation published a new report today, Developing, Owning, and Operating Shallow Bay Industrial Buildings, which draws on interviews with more than two dozen developers, investors, lenders and architects to examine best practices for acquiring, operating and developing this niche segment of the industrial sector.

August 2026 CREDA Research Foundation shallow-bay-industrial-buildings

Key Takeaways:
Multitenant shallow bay industrial buildings serve a diverse range of local and regional businesses, making them less sensitive than larger logistics facilities to booms and busts.

Demand for shallow bay space is usually greatest near population centers and transportation thoroughfares. Higher land costs in these locations and higher per square foot construction costs for smaller buildings have limited new construction of this product type.

Many investors in the shallow bay space focus on buying vintage properties and marking their rents to market or retrofitting them to attract higher rents. Although the volume of new shallow bay construction has been limited, developers report making profitable investments in ground-up shallow bay projects where there is adequate demand.

Developing strong tenant relationships is particularly important for effectively managing shallow bay properties. Close cooperation between property management and leasing teams can help owners retain tenants and improve decisions on rental rates and capital expenditures.

To strike the right balance between a project’s density, functionality and costs, it is critical for developers of new shallow bay buildings to understand prospective tenant needs. Not all tenants need deep truck courts or 32-foot clear heights, but a denser site plan and lower-cost design can permanently limit a building’s marketability.

Industrial real estate shifts inland as power grid constraints dictate future hub locations

By Katie Ann McCarver
Las Vegas Sun / Vegas Inc
Aug. 31 https://vegasinc.lasvegassun.com/business/2026/aug/31/companies-swap-just-in-time-inventory-for-regional/

Commercial real estate is being reshaped by a fundamental shift in how companies manage inventory
— moving away from just-in-time (JIT) methodology, with minimal stock on hand, toward just-in-case
(JIC), the amassing of “safety stock” to buffer against supply disruption.

“Disruption is the new baseline,” said Ruben Ramirez, head of occupier services for the Americas
Industrial & Logistics division at CBRE, a commercial real estate services firm headquartered in
Dallas. “It’s not the exception anymore. So you’ve got to plan for disruption.”

Ramirez and John Kirkman, managing senior director and supply chain advisory leader at CBRE, laid
out the shift during a panel discussion, “Navigating the Modern Supply Chain,” hosted by CREDA,
the Commercial Real Estate Development Association, Southern Nevada chapter, on Aug. 20 at
The Orleans in Las Vegas. Hundreds of local commercial real estate players, UNLV students and other
stakeholders attended.

“Supply chain’s happening. Real estate’s happening,” Ramirez said. “Are the conversations happening
together?”
He pointed to disruptions including trade volatility and tariff instability, global shocks like the COVID19 pandemic, port congestion, shipping delays, closure of the Strait of Hormuz and inflationary pressures as drivers of the shift.

A JIT supply chain is typically more about managing cost than unlocking revenue, and tends toward
real estate that is port-proximate and in import gateways. That’s changing, Kirkman said.
“Just-in-case inventory places inventory closer to consumption,” he said, naming midcontinent markets
like Columbus, Ohio, Kansas City, Mo., or Dallas as beneficiaries. “We’re seeing the center of the U.S.
emerge as epicenters and hubs.”
Companies are moving from one or two large coastal or inland hubs, Kirkman said, to three or four
regional hubs.

Year-to-date, port-proximate warehouse absorption — the rate at which warehouse space gets rented or
sold — has hit a 15-year low, Ramirez said. In 2021-22, by contrast, 500 million square feet were
added to net new industrial demand because of the pandemic.
“That absorption wasn’t about e-commerce,” Ramirez said. “It was about inventories. It was about that
safety stock. It was about that shift to just-in-case — that was where that demand was coming from.
And we’re seeing a shift to that again, as more companies are, again, planning for that disruption.”

JIC is “buffer heavy,” meaning it’s built to manage swings in marketplace demand, Kirkman said.
Compared to a JIT scenario, distribution centers in a JIC supply chain are adding 15 to 25% more
square footage for the same throughput, among other changes.
Third-party logistics companies are increasingly a huge swath of industrial leasing, Ramirez said,
largely because other businesses use them to test liability in new markets and automation.
The risk of a JIT supply chain is its lack of buffer when the network is disrupted, Kirkman said —
“you’re exposed.” In JIC, the primary risk is cost.
“There’s always a healthy tension between service and cost in the supply-chain world,” he said. “When
we think about just-in-case inventory, your cost increases dramatically from an inventory-holding
position.”

Most companies sit somewhere between the two models, Kirkman said, though the center of gravity is
veering toward JIC.
Kirkman outlined the key variables companies weigh: throughput, or how much a company wants to
process each day; the scope of products and their storage; safety stock; and how many pallet positions
exist relative to the days of safety stock needed.
Safety stock — how much excess product a business has, and how many days it can last before its next
inbound shipment — is the variable most affected by what Kirkman called the “disruption decade.”
“Buffer stock protects revenue,” he said. “The biggest winners during COVID were those that had
excess inventory — poor inventory positions, comparatively, for just-in-case — but had the inventory
on hand. It really is protecting your revenue function; making sure that, as disruption events happen,
you’ve got the inventory on hand, whether it be parts, whether it be finished goods or the
manufacturing products.”

These shifts have also reset the baseline for building specifications, with a need for three to five times
higher power density, 36-foot clear heights and smart building infrastructure like fiber and edge
compute, according to the presentation. Retrofitting existing properties to meet that standard is difficult,
Kirkman said.
“It’s not just slapping lipstick on,” Ramirez said. “It’s major surgery.”

On site selection, the two discussed new criteria — water access governance, term flexibility and more
— layered onto existing needs like transportation infrastructure and labor availability.
Power is becoming a primary constraint, per the presentation, driven by tariffs, emergency orders, data
centers and interconnection queues increasingly controlled by private equity — which, Kirkman said,
“certainly don’t have Joe Consumer’s best interests at heart.”
“No longer is it, ‘Let’s look at the transportation cycle, labor and then incentives,’” Kirkman said. “It’s
now saying, ‘OK, how much power do you need? Where in the country is there power?’ And then
evaluate the efficacy of it as a supply chain hub after that, which is kind of flipping the conversation on
its head.”

He also pointed to growing automation, with companies closing distribution centers in one area to open
automated facilities elsewhere.
Site selection used to hinge on having people to pack boxes, Kirkman said; now it’s about having
technicians who can work with the technology. Fewer employees doesn’t mean lower cost, he added,
since those technicians tend to be paid more than the packing jobs they replace.
“The tension there is, we’re wildly understaffed for a technical workforce,” Kirkman said. “These
private companies are shopping around on their own to teach up these folks, but there’s just a mass
skills trade shortage in the United States today.
Debt Market Survey, Second Quarter 2026

By: Omar Eltorai, Senior Director of Research, Altus Group

Release Date: August 2026

A Market Leaning Back Toward Fixed-Rate Loans

Data from Altus Group’s second-quarter 2026 survey of commercial real estate (CRE) borrowers and lenders point to a market where the source of relief has shifted. Treasury yields climbed, pushing fixed-rate all-in costs higher, while the Secured Overnight Financing Rate (SOFR) flattened after several quarters of decline. That left floating-rate borrowers relying on spread compression rather than a falling base rate. Quote activity ticked down slightly after the first quarter’s rebound, and the product mix tilted back toward fixed-rate products, led primarily by short-term fixed-rate debt. Spreads narrowed across most of the market, with the sharpest compression occurring in floating and mezzanine products, while quote activity shifted toward office and retail and away from industrial loans.

Market Activity

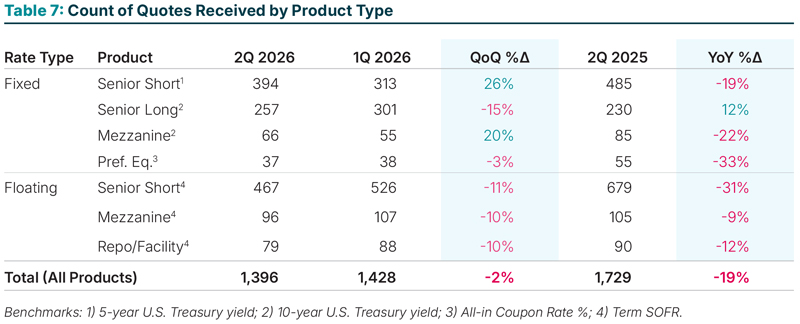
Quote volume eased in the second quarter. Survey participants reported 1,396 quotes, down about 2% from the first quarter’s 1,428. The pullback was modest, leaving activity near recent levels after a strong first quarter. Year over year, volume remains 19% below the 1,729 quotes logged in the second quarter of 2025.

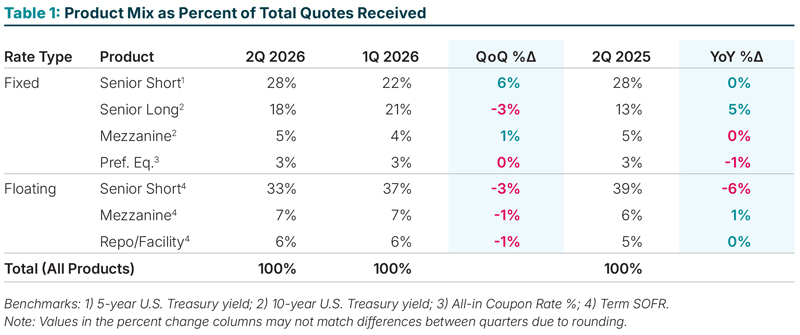
The product mix tilted toward fixed-rate products, which made up 54% of quotes versus an even 50/50 split between fixed- and floating-rate in the first quarter. The clearest move was in fixed-rate senior short-term loans, which rose to 28% of quotes from 22%, while fixed-rate senior long-term slipped to 18% of quotes from 21%. Floating-rate senior debt remained the most quoted product at 33%, down from 37%.

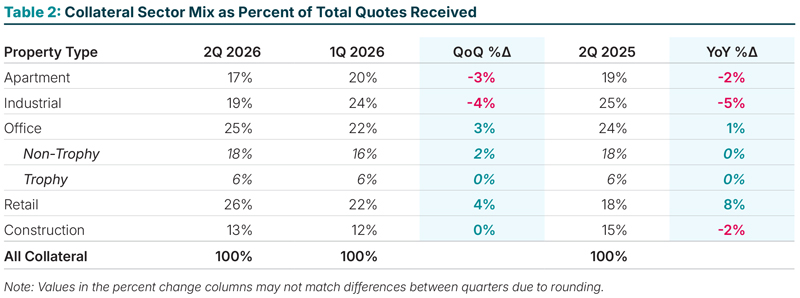
The collateral mix shifted meaningfully between the first and second quarters of 2026. Retail led all sectors, capturing 26% of quotes, up from 22%. Office climbed to 25% from 22%, into the No. 2 spot. Industrial, the most quoted sector in the prior quarter, dropped to 19% from 24%. Apartment eased to 17% from 20%, and construction held near 13%. The increase in office and retail quotes is worth watching because these sectors tend to price wider than apartment and industrial and may pull the market-wide averages higher as a result.

Benchmark and Spread Trends

Benchmarks kept moving against fixed-rate borrowers in the market for financing. The 5-year U.S. Treasury yield averaged roughly 4.09% during the second quarter, up about 32 basis points (bps) from the first. The 10-year Treasury settled near 4.42%, up about 22 bps. SOFR barely moved, easing around 4 bps to 3.62%. The decline in SOFR that drove floating-rate relief through late 2025 and early 2026 has stalled, but spreads compressed in the second quarter. On a quote-weighted basis, floating-rate and mezzanine spreads led the narrowing, while fixed-rate senior short-term spreads held roughly flat. That said, through the second quarter, market consensus shifted from anticipating additional rate cuts to pricing a greater risk of further tightening. This shift in market expectations helps to explain the renewed quoting activity for short-term fixed-rate financing.

Apartment and Industrial Holding Tight

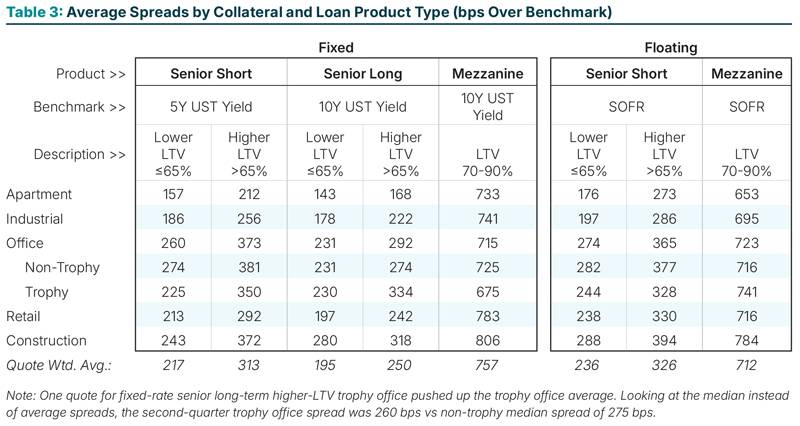
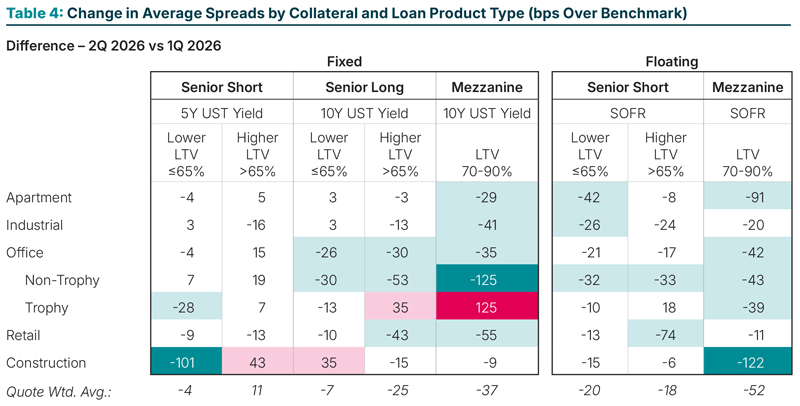
Apartment spreads stayed the tightest in the market. Senior long-term fixed-rate loans on apartments priced at 143 bps over the 10-year Treasury for lower-leverage deals, remaining essentially flat quarter over quarter. Industrial came in at 178 bps for the same product and leverage, also largely unchanged. The largest moves occurred on the floating-rate side, with apartment senior short-term spreads tightening 42 bps and industrial repo/facility spreads dropping 46 bps.

Office Compresses on the Long End

Office quotes reveal a mixed picture. Senior long-term fixed-rate spreads compressed, tightening about 30 bps for lower-leverage non-trophy deals to 231 bps. Floating-rate spreads narrowed as well. But fixed-rate senior short-term spreads held firm to slightly wider, with higher-leverage readings pushing up. That partly reflects a jump in office fixed-rate senior short-term quote volume, which shifts the composition of the office average. The trophy versus non-trophy gap is worth noting. For lower-leverage senior long-term fixed-rate loans, the two priced within a basis point of each other, continuing the narrowing trend observed over the past several quarters. A few wider trophy readings sit on very thin quote counts and read as noise rather than signal. For this reason, the divergence in fixed mezzanine quotes for non-trophy and trophy office properties can be taken with a grain of salt.

Retail Spreads Narrow

Retail reversed course from the prior quarter, when spreads had widened. In the second quarter, they tightened. Higher-leverage floating-rate senior spreads tightened 74 bps, and higher-leverage senior long-term fixed-rate spreads narrowed 43 bps. The pullback lines up with retail’s jump in quote share and suggests lenders became more active after the prior quarter’s recalibration.

Construction Widest, but Mixed

Construction remains the widest-priced corner of the market, and its readings stayed volatile. Lower-leverage senior short-term fixed-rate spreads dropped 101 bps to 243 bps, but the quote count behind that bucket more than doubled from the prior quarter, so the move likely reflects sample composition more than a clean pricing shift. Fixed-rate mezzanine held near 806 bps, still the highest across all collateral types. Given the limited quote volumes, these readings are best treated as directional.

All-in Rates

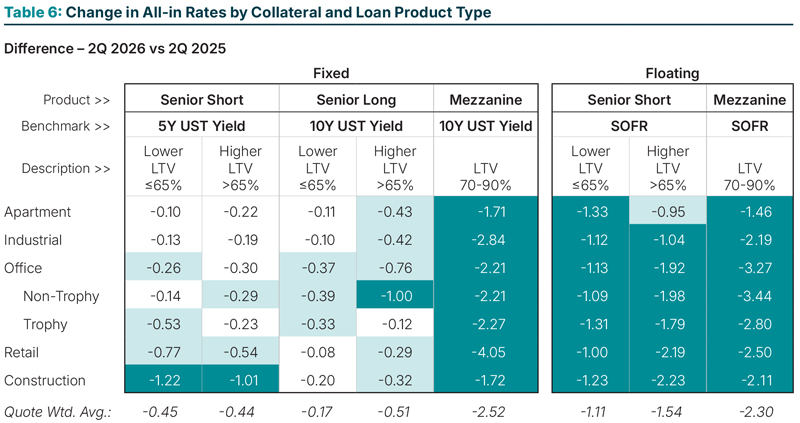
The split between rising Treasury yields and flat SOFR produced a clear divide in the cost of capital across products. Fixed-rate all-in costs rose, led by senior short-term loans tracking the 5-year Treasury higher. Fixed-rate senior long-term costs came in closer to flat, as spread compression offset most of the 10-year benchmark’s rise. Floating-rate costs fell across nearly every property type, driven by tighter spreads rather than a lower benchmark rate.

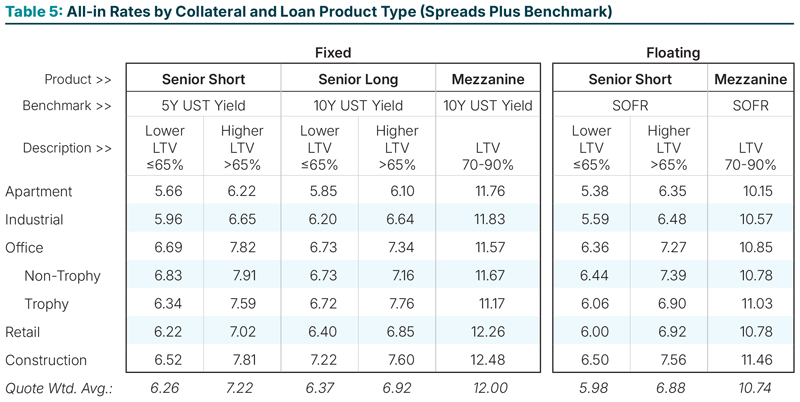
For apartments, lower-leverage senior long-term fixed rates rose 25 bps to 5.85%, while floating-rate senior loans dropped 45 bps to 5.38%. Industrial followed, with fixed senior long-term at 6.20% and floating-rate senior down 30 bps to 5.59%.

Office all-in costs improved on both the fixed long end and the floating side. Lower-leverage senior long-term fixed rates edged down 4 bps to 6.73% as spread compression more than offset the benchmark rise, and floating-rate senior costs fell 25 bps to 6.36%. Construction stayed the most expensive part of the market, with lower-leverage senior long-term fixed rates rising to 7.22% and floating-rate senior costs easing to 6.50%.

The upshot is a wider gap between fixed and floating than borrowers faced a quarter ago. For lower-leverage senior debt, floating now prices below fixed across every major sector. Apartment floating-rate runs about 48 bps under comparable fixed-rate products, industrial about 61 bps, and office about 37 bps. In the first quarter, those gaps were slim or reversed, and apartment floating-rate financing priced above fixed. What changed is the driver of that fixed-vs-floating rate gap. In the prior quarter, floating looked cheaper because SOFR was falling and expected to fall further. This quarter, it looks cheaper because fixed got more expensive, driven by the benchmark yields. For borrowers deciding whether to lock in a rate, that distinction matters. The floating-rate advantage now depends on rates remaining stable, leaving borrowers more exposed if the Federal Reserve adopts a more hawkish stance than expected. A fixed-rate product costs more today but removes that risk. Neither is the clear choice, and the right call turns on the hold period and the borrower’s read on the rate path from here.

Looking Ahead

Second-quarter data show a CRE financing market that remains steady despite a stubborn rate backdrop. The data reflect the daily reality of getting deals financed; the easy tailwind is gone. Falling SOFR helped lower borrowing costs for more than a year, but that source of relief appears exhausted for now. At the same time, higher Treasury yields have made fixed-rate financing more expensive than it was in the spring.

There is a silver lining: Lenders appear to be leaning back in. Office spreads narrowed on the long end, the trophy gap all but closed, and retail moved to the front of the quote board as its pricing tightened. Credit tends to warm to a sector before values fully reset, so owners and developers weighing those sectors may find debt more available than the headlines suggest. Construction financing remained expensive and was the most uneven corner of the market, a reminder that lender appetite for ground-up development risk remains selective. The practical approach is to underwrite to rates near current levels rather than counting on a hoped for and increasingly less likely rate cut, to keep fixed-rate exposure short where refinancing optionality has value and to treat further spread tightening as a potential upside rather than base case.

About the Survey

This report draws from a sample of data from U.S. respondents to Altus Group’s CRE Debt Capital Markets Survey, a quarterly industry survey collecting anonymized data from borrowers and lenders on commercial real estate debt pricing, loan terms, origination volumes, collateral values, leverage and other metrics across the U.S. and Europe to improve transparency and provide benchmarking insights. Survey participants are provided with access to additional information than is contained in this report. To learn more about the survey and participate in future surveys, visit: altusgroup.com/featured-insights/cre-debt-capital-markets-survey-registration/

Survey participation eased modestly in the second quarter, with total responses of 1,396 quotes, down about 2% from the first quarter’s 1,428. Activity is holding near recent levels after the first-quarter rebound.


About the Commercial Real Estate Development Association

The Commercial Real Estate Development Association (CREDA) is the leading global professional organization for the commercial real estate industry, representing more than 21,000 members across 55 chapters in North America. CREDA equips professionals with the resources, relationships and insights needed to advance their careers through high-impact networking, practical education and forward-looking research. As a trusted voice at the forefront of the industry, CREDA drives innovation in development by advocating for legislation that supports commercial real estate growth and delivering data-driven insights through the CREDA Research Foundation.

The CREDA Research Foundation was established in 2000 as a 501(c)(3) organization to advance the knowledge of the commercial real estate development industry through objective research, analysis and education. By delivering data-driven insights on the industry’s economic impacts and market dynamics, the Foundation equips industry leaders, policymakers and stakeholders with information they need to make informed decisions and create thriving communities. For more information, visit credaresearch.foundation.

About the Author

Omar Eltorai is senior director of research at Altus Group, where he covers U.S. macroeconomics, capital markets and commercial real estate. He co-hosts the CRE Exchange podcast and regularly authors industry reports. He presents his analysis at industry events, and his commentary is often featured in the media and commercial real estate publications.

Media Inquiries

Please contact Brielle Scott, director of marketing and communications, at bscott@credaglobal.org.

Disclaimer

This project is intended to provide information and insights to industry practitioners and does not constitute advice or recommendations. The CREDA Research Foundation disclaims any liability for actions taken as a result of this project and its findings.

© 2026 Commercial Real Estate Development Association Research Foundation


Shallow bay industrial buildings – long overlooked in favor of larger, single-tenant logistics facilities – are drawing renewed attention from institutional investors and lenders as constrained supply and resilient tenant demand set the stage for continued outperformance

The CREDA Research Foundation published a new report (Read the Report: Developing, Owning and Operating Shallow Bay Industrial Buildings ) which draws on interviews with more than two dozen developers, investors, lenders and architects to examine best practices for acquiring, operating and developing this niche segment of the industrial sector.
Key Takeaways:
  • Multitenant shallow bay industrial buildings serve a diverse range of local and regional businesses, making them less sensitive than larger logistics facilities to booms and busts.
  • Demand for shallow bay space is usually greatest near population centers and transportation thoroughfares. Higher land costs in these locations and higher per square foot construction costs for smaller buildings have limited new construction of this product type.
  • Many investors in the shallow bay space focus on buying vintage properties and marking their rents to market or retrofitting them to attract higher rents. Although the volume of new shallow bay construction has been limited, developers report making profitable investments in ground-up shallow bay projects where there is adequate demand.
  • Developing strong tenant relationships is particularly important for effectively managing shallow bay properties. Close cooperation between property management and leasing teams can help owners retain tenants and improve decisions on rental rates and capital expenditures.
  • To strike the right balance between a project’s density, functionality and costs, it is critical for developers of new shallow bay buildings to understand prospective tenant needs. Not all tenants need deep truck courts or 32-foot clear heights, but a denser site plan and lower-cost design can permanently limit a building’s marketability.

Commercial Alliance Las Vegas Educational Symposium
Thursday, September 25, 2025
Las Vegas Realtors

Discount for NAIOP Members and other Industry Partners 
Appraisal, BOMA, CCIM, CREW, IREM, LIED, NVSAA, SIOR and ULIN

NAIOP members register HERE

NOTE: Use the drop down arrow at the top to register at the discounted rate.

The QR code registration will now allow the discount, see above.

NAIOP Southern Nevada partnered with SNWA and other relevant industry trade groups at LVVWD headquarters in September to provide education and training about proper evaporative cooling equipment maintenance, new technologies in the evaporative cooling industry, and other ways to prevent costly repairs and save water in the community. There are numerous local, state and federal incentives for expenditures related to more efficient evaporative cooling equipment! Contact us for more info. A special thank you to BOMA, IREM, NPFMA, and SNARSCA and our guest speakers John Bowman, Matt Vaccaro, and Robert Young.

The Bureau of Reclamation (BOR) is projecting slightly improved conditions along the Colorado River, which will ease federally-declared water cuts for Southern Nevada next year. The BOR will move from a Tier 2 to a Tier 1 level water shortage beginning in January 2024.

Southern Nevada’s water supply will be reduced by 7 percent under the Tier 1 conditions. Under the current Tier 2 reductions for 2023, Nevada’s Colorado River water allocation was reduced by 8 percent.

While local water demands continue to be well below the shortage volumes, water conservation remains one of the most effective tools to protect the community’s water supply. The Southern Nevada Water Authority (SNWA) recently augmented two of its water conservation incentive programs to help the community save water.

The SNWA increased its incentives for Water Efficient Technologies (WET) projects to improve the efficiency of existing evaporative cooling systems. The incentive changes include removing the $500,000 annual cap for evaporative cooling system upgrades or replacements. The total WET incentive will continue to cover up to 50 percent of the total project cost.

To expand and diversify the community’s urban tree population and to help reduce the impacts of a warming climate, the SNWA added a cash incentive of $100 per new tree planted as part of a Water Smart Landscapes project.

The tree rebate is in addition to the $3 per square foot incentive for replacing grass with drip-irrigated landscapes. Residential, business, multifamily and HOA properties participating in the WSL rebate automatically will be considered for the tree incentive as part of the program enrollment (some restrictions apply).

For more information about the WSL and WET rebates, visit snwa.com.

For more information about how your business can be part of the conservation solution, visit snwa.com.


The August NAIOP Members-Only Education Program, Legislative Pool Party – Deep Dive into the 2023 Legislative Session, was held on August 25th and sponsored by Argentum Partners. Hosted by Kerry Kramer and John Leleu the program provided an overview of the 83rd session of the Nevada Legislation that commenced in February. While there was optimism that there would be bi-partisan agreements during the session, it was glaringly apparent from the get-go that any hope of balance and communication would quickly be dashed by national political talking points, partisan politicking, in-fighting amongst the parties and between the houses, and huge last-minute policy issues that ultimately derailed the 2023 Session straight into 2 Special Sessions, and the prospect of a third later in the year. In total, of the 1,044 bills voted on in the session, 610 (58%) were passed by legislature, 535 were signed (88%) and 75 (12%) were vetoed.

Some of the signed legislation that would have an effect on the Commercial Real Estate market included:

  • AB 210 – Electronic documentation requirements for prevailing wage payments.
  • AB 50 – Enhanced penalties for organized retail crime.
  • SB 30 – Protection of public safety regarding the sale of Healthcare related data without consent.
  • SB 281 – Increased transparency for rate changes from natural gas utility companies.
  • AB 448 – Removed exemptions that allows a company with the same ownership to purchase or transfer a property for the purpose of avoiding the payment of the Real Property Transfer Tax.

Overall, the program was very informative and provided NAIOP members in attendance a behind the scenes look into the Nevada Legislative process. Slides to the program are HERE.

The Members-Only Education programs are planned by the Education Committee who meet monthly to plan several exclusive Member’s Only workshop each year.  The goal is to keep our members up-to-date and in the know of current happenings in commercial real estate in Southern Nevada.  This committee focuses on unique content which is aimed to evoke in depth conversation within our workshops and provide one of NAIOPs best networking opportunities. If you would like more information about the Education Committee or on upcoming education programs contact Jennifer Turchin at Jennifer@codagroupinc.com or 702-795-2285.

Written by:

Matthew Weinberger
Director of Business Development
Martin-Harris Construction
matthew.weinberger@martinharris.com
702-474-8209 Direct

A renewed commitment to conservation helped Southern Nevadans reduce community-wide water consumption by more than 7 percent in 2022, saving 5.8 billion gallons in one year.

Over the past 20 years, the community has implemented a wide range of comprehensive water conservation initiatives to change how it uses water. These conservation efforts helped Southern Nevada consume 32.5 billion gallons less water in 2022 than in 2002, despite a population increase of approximately 780,000 new residents during that time.

To ensure businesses and residents continue to be water smart, the Southern Nevada Water Authority (SNWA) and its member agencies have enacted several new conservation measures to drive down water consumption and ensure the Las Vegas Valley has a sustainable economy and water supply.

SNWA continues to see a strong response from the business, HOA and multi-family residential sectors. Many of these property owners are actively replacing decorative grass in streetscapes, medians, common areas and other locations where it is used for aesthetics and not recreational purposes.

Under Nevada law, by the end of 2026, non-functional grass at commercial complexes, HOA common areas, government facilities and multi-family properties may not be irrigated with water delivered by SNWA member agencies. The law will save billions of gallons of the community’s water supply when fully enacted.

The SNWA Water Smart Landscapes (WSL) rebate currently provides a cash incentive of up to $3 a square foot to qualifying properties to replace grass landscapes with drip-irrigated trees and plants (some restrictions apply). The SNWA is encouraging businesses to apply for the WSL rebate sooner rather than later while funding is available.

For more information about how your business can be part of the conservation solution, visit snwa.com.


Conservation efforts helped Southern Nevada consume 32.5 billion gallons less water in 2022 than in 2002, despite a population increase of approximately 780,000 new residents during that time.

The SNWA is encouraging businesses to apply for the Water Smart Landscapes (WSL) rebate while funding is available and before the 2026 deadline to meet the requirements of a new state law prohibiting decorative grass.

©2026 CREDA Southern Nevada - All rights reserved.